GLOBAL BRAIN INSTITUTE
IQ research . Assessment
Adhering to fairness, transparency, and accuracy, we provide a most accurate assessment of an individual's intelligence. Here are some key elements of the IQ scoring method:
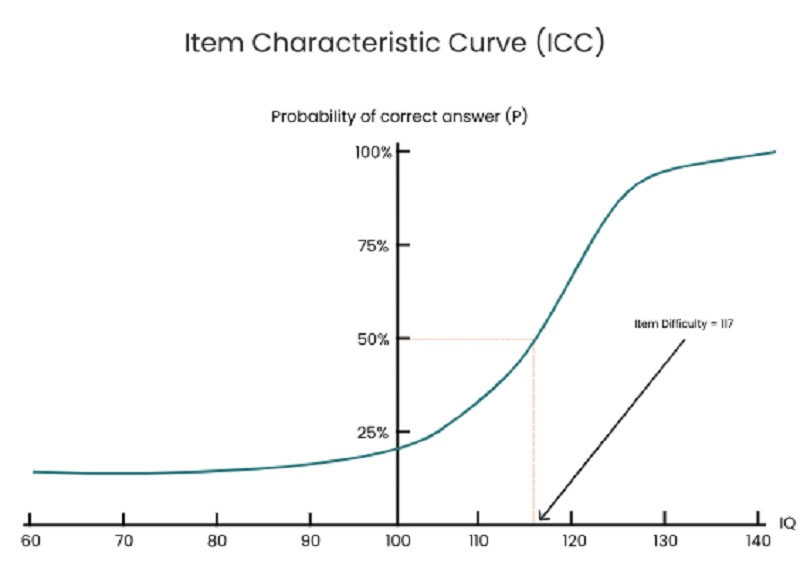
Each participant has 20 minutes to answer 30 questions. The question difficulties are categorized based on a Rasch and 2PL-IRT model, which are derived from the results of over half a million individual test-takers who completed the test.
Under the Rasch model, the difficulty level of the items gets transformed via the same logit transformation because we assume that the difficulty of the items also follows a normal distribution.
In this case, the number of people who correctly answered a given item is a sufficient statistic for our equation. That is, all we need to know is the percentage of people who answered a given item correctly and we can transform item difficulty to arrive at a logit value that can be placed on the same logit scale as person ability.
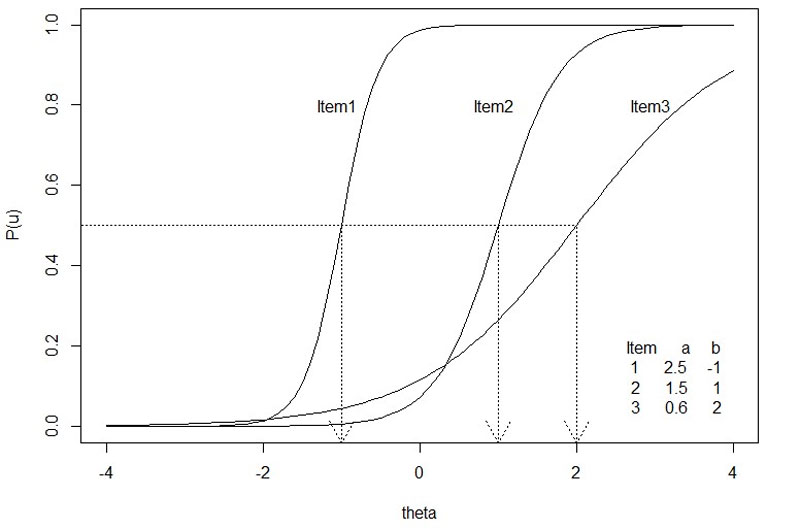
The IRT (Item Response Theory) model is a statistical framework commonly used in the field of educational and psychological assessment to understand and model the relationship between an individual's ability or trait level and their responses to a set of items or test questions. This model is often used to analyze and score IQ tests, among other types of assessments. IQ, or intelligence quotient, is a measure of cognitive ability and is typically assessed using a variety of test items or questions.
First and foremost, the participant starts the test at the level 1 question (the easiest one). Then, for each correct answer, the difficulty level increases by 1. Otherwise, for each wrong answer, the question’s difficulty decreases by 1. Points earned for a right answer correspond to the difficulty level of the question. Incorrect answers do not result in any points being earned. With this feature enabled, the participants will see a fresh combination of questions each time they attempt the activity.
You're taking our online IQ test designed with adaptive question adjustment. Here's how it work:
Starting Point: The system begins by presenting a question of average difficulty to the test-taker.
Response-Based Adjustment:
Continuous Adaptation:
End of the Test:
By the end of the test, the system has a detailed performance profile based on how you responded to various difficulty levels. Instead of just counting the number of correct answers, it considers the difficulty of the questions you answered correctly. So, if you answered more challenging questions correctly than someone else, you might receive a higher IQ score, even if you both answered the same total number of questions correctly.
The points you get from correct answers are summed to create the Raw Score. Then, the raw score will be compared to the entire population to convert to the final IQ score, with the mean of 100 and the standard deviation of 15.
Using the Rasch Measurement, the presumption of normality is evident when raw scores, which represent the proportion of correctly answered items, undergo a logit transformation. This transformation can be expressed as in the logit equation:
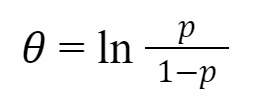
where:
? is the individual's ability.
p is the proportion of items that an individual has the correct answer.
In the Rasch model framework, any individual has a certain probability of either passing or failing any test item, regardless of its level of difficulty. This implies that it's possible for any individual to produce any combination of responses. Even the most proficient person might not get every question right.
Typically, the estimation of a person's measure is based on the most probable observed response pattern, or the response pattern that aligns best with the Rasch model. Yet, sometimes we might have a preliminary idea of a person's ability measure (or an item's challenge level) before gathering current data. We might want to merge this preliminary insight with the new estimation. To do this, we initially calibrate the test items as standard. Then, by integrating the item calibrations, our initial insight, and the observed responses, we derive an enhanced, post-data, measure for the individual. This method is rooted in Thomas Bayes' realization:
Prior Probability x Likelihood from Data = Posterior Probability.
This means: Prob (B' given {X}) = Prob (B') x Prob ({X} given B') / Sum of all B [ Prob (B) x Prob ({X} given B) ],
Where B' signifies a specific value of the individual's measure. The sum pertains to all potential values of our initial idea, B. {X} denotes the individual's set of responses. The EAP estimate for the individual's measure is the expected outcome of this calculation.